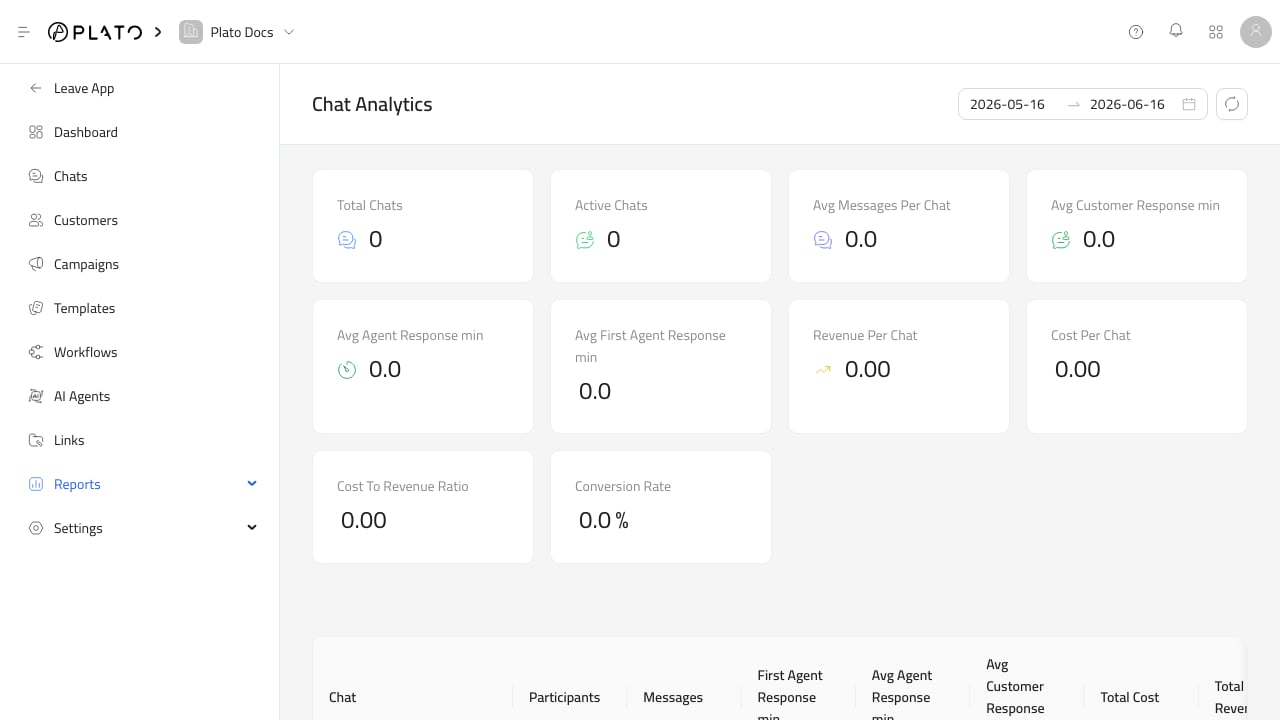
Chat Analytics
UseChat Analytics to review conversation volume and response behavior.
This report includes total chats, active chats, average messages per chat, average customer response, average agent response, average first agent response, revenue per chat, cost per chat, cost-to-revenue ratio, and conversion rate.
Open it when you need to understand support load or reply quality. See Chat Analytics.
Customer Distribution
UseCustomers Distribution to see customer address density on a map.
This is useful for delivery planning, location targeting, and understanding where customers are concentrated.
See Customer Distribution.
Campaign Insights
UseCampaign Insights after sending campaigns.
This report shows total campaigns, total messages, average success rate, average failure rate, total costs, average campaign cost, recipients, sent, pending, failed, success rate, and last activity.
See Campaign And Template Insights.
Template Insights
UseTemplate Insights to compare reusable messages.
This report shows total templates, total messages, success and failure rates, cost, sent, pending, failed, and last used date.
See Campaign And Template Insights.
Link Analytics
UseLink Analytics to understand how short links perform.
It includes clicks over time plus breakdowns for short links, destination URLs, referrers, UTM parameters, countries, regions, cities, continents, devices, browsers, operating systems, and triggers.
See Link Analytics And Events.
Link Events
UseLink Events for event-level click or QR scan details.
Each event can show the trigger, link, time, country, city, region, device, browser, operating system, referrer, coordinates, and other metadata when available.
See Link Analytics And Events.